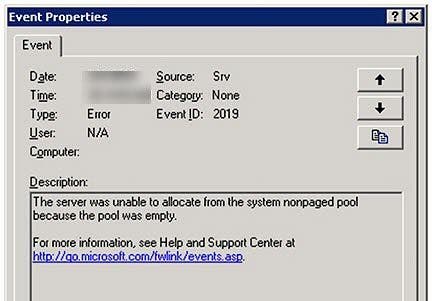
One of my client’s servers needs to be rebooted three times a day because of server hangs. A look in Event Viewer finds the following error corresponding to the time the server stops responding:
Event: 2019, Source: SRV
"The server was unable to allocate from the system nonpaged pool because the pool was empty"
They reboot the server, and the problem goes away for a while.
I performed some searches and found many potential known causes of this error, from Norton Antivirus 7.0-8.0 to Symantec Antivirus 10.x to ARCServe to SQL Server, but none of the suggested fixes resolved the issue. I used the following articles during the troubleshooting process:
KB 133384 for using Performance Monitor but couldn’t isolate the source of the memory leak.
KB 943998 regarding a HP NIC driver issue, KB 294346 regarding an 3com/IBM NIC driver issue
KB 895477 regarding WMI problems that may or may not be related to SMS and/or SQL
KB 822219 describes filter driver issues relating to backup or antivirus software, specifically ARCserve and Veritas products
KB 870973 describes a hotfix for a leak in the Volume Shadow Copy service
KB 102985 describes registry settings you can specify for memory usage – see NonPagedPoolSize
Windows 2000 – Evaluating Memory and Cache Usage – Optimizing Your Memory Configuration
I used the following tools to try and diagnose the source of the memory leak:
Poolmon.exe per KB 177415. Warning – using poolmon is not for the faint of heart
Performance Monitor Wizard and Perfmon.exe per KB 248345 for finding memory resource issues. The Performance Monitor Wizard simplifies the process of gathering performance monitor logs. It configures the correct counters to collect, sample intervals and log file sizes for troubleshooting.
Debug Diagnostic Tool 1.1 – Designed to assist in troubleshooting issues such as hangs, slow performance, memory leaks or fragmentation, and crashes in any Win32 user-mode process. The tool includes additional debugging scripts focused on Internet Information Services (IIS) applications, web data access components, COM+ and related Microsoft technologies
User Mode Process Dumper Version 8.1 per KB 241215 – The User Mode Process Dumper (userdump) dumps any running Win32 processes memory image (including system processes such as csrss.exe, winlogon.exe, services.exe, etc) on the fly, without attaching a debugger, or terminating target processes. Make sure to use the correct version for your CPU.
Windows Server 2003 Performance Advisor – Performance diagnostic tool for Windows Server 2003 and Windows Server 2003 Service Pack 1 (SP1)
Memtriage.exe – Resource Leak Triage Tool, a part of the Windows Server 2003 Resource Kit Tools
gflags.exe – see KB 262386 for example usage for diagnosing memory leaks
Memsnap.exe – This command-line tool takes a snapshot of the memory resources being consumed by all running processes and writes this information to a log file.
Debugging Tools for Windows was over my head, probably not useful except for programmer types.
This article has a nice description of using Process Explorer to determine your system’s maximum values for Paged and NonPaged Pools, while this one talks about troubleshooting memory leaks. This one discusses capturing application crash dumps, which allows for debugging services such as Print Spooler.
After using all these tools, I finally found the source of my problem with plain old Windows Task Manager. This article suggested viewing the Handle Count, with processes over 5,000 being suspect. Once I viewed the Handles column it was blatantly obvious JMBtnMgr.exe was the memory hog. I watched the handle count grow from 2,100 to over 6,000, when the server became unresponsive.
After restarting the server I found a shortcut to JMBtnMgr.exe in the Administrator startup menu. I took the shortcut out of the startup menu, restarted the server one more time, and haven’t found it hung in four days.
I suspect I also could have monitored Task Manager’s Non-Paged Pool Usage as well and would have found similar results. To view the NP Pool usage in Task Manager, click View – Select Columns – Non-Paged Pool
